


With this software application we aim to support doctors and researchers in the field of rare diseases, as well as patients and their families, through knowledge of research on these conditions. We show who in the Netherlands is furthering our knowledge of rare diseases and publishing peer reviewed research and how that in turn enables other research, through citation analysis.
Netherlands Federation of University Medical Centers (NFU) and Elsevier hope to contribute to the organization, understanding and ultimately treatment of rare diseases through this work. This project is part of the Open Science agreement between the Universities of the Netherlands, Netherlands Federation of University Medical Centers (NFU) and Elsevier.
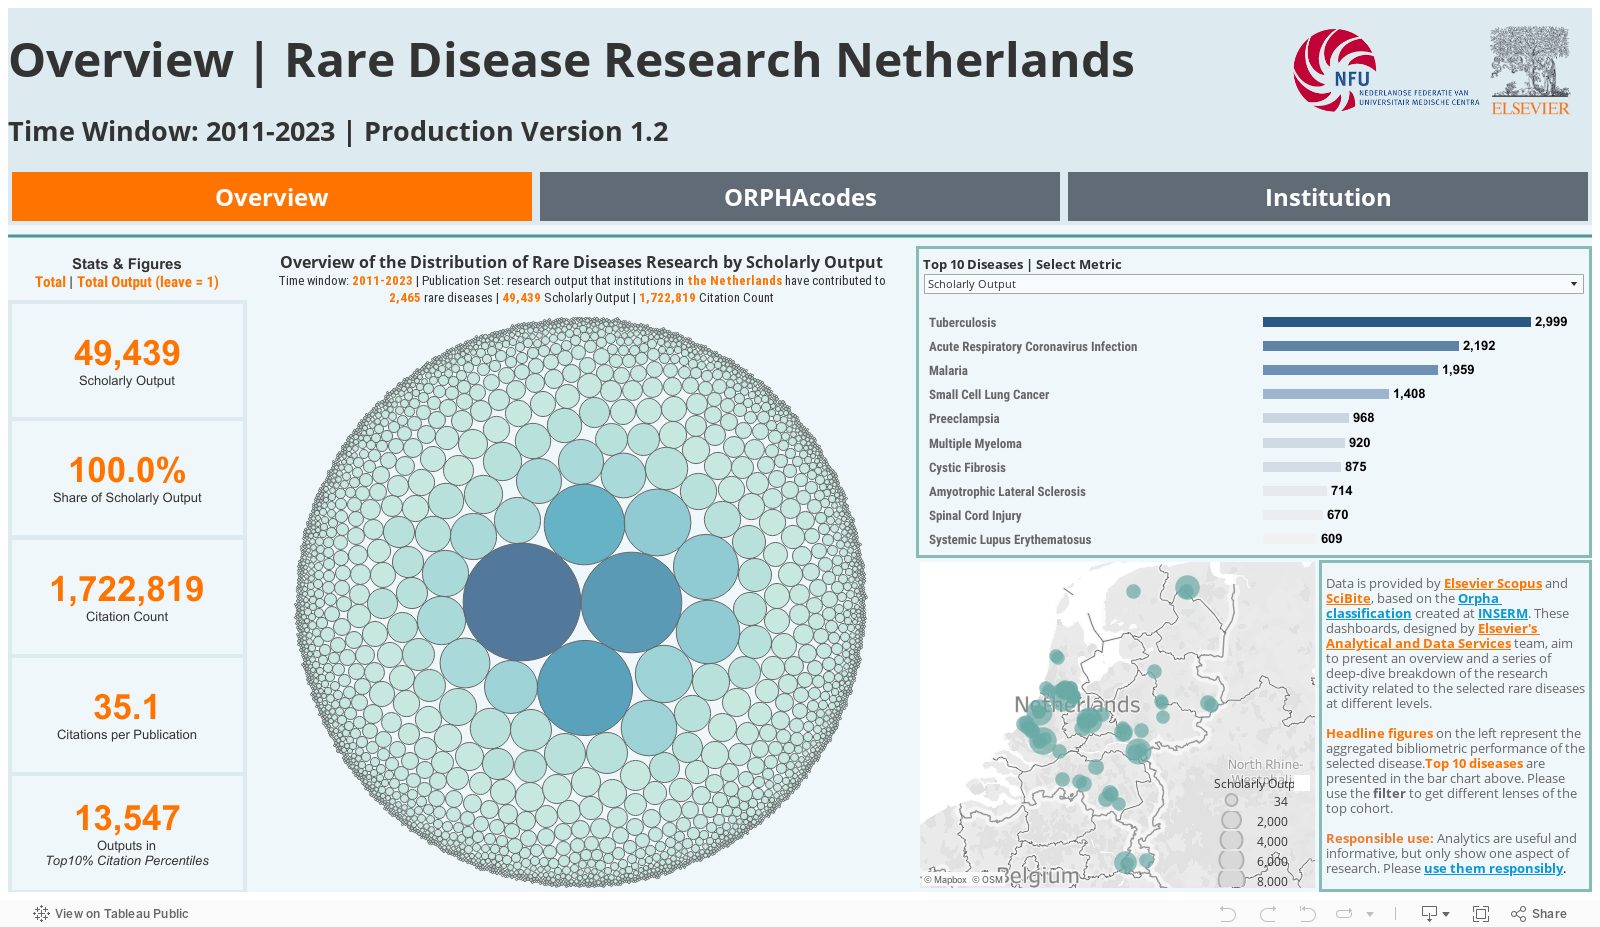
Table of contents
Why focus on rare diseases?
Rare diseases and/or syndromes occur in fewer than 1 in 2,000 people but can also be a tumour that occurs in less than 6 in 100,000 people per year. It is estimated that 6-8% of the Dutch population is affected by one of the approximately 8,000 different rare diseases. Rare diseases are often life-threatening or chronic and difficult to recognise and diagnose.
By offering this software tool, the partners hope to make knowledge and scientific information about rare diseases more available and accessible. With the aim of further improving care and treatment for people dealing with rare diseases.
Centres of expertise and European Reference Networks
Both the Netherlands, and Europe as a whole, have the ambition to provide optimal care and treatment opportunities for every rare disease patient. In the Netherlands there are approximately 350 centres of expertise that are acknowledged by the Ministry of ‘Volksgezondheid, Welzijn en Sport’. All these centres of expertise meet European criteria. These centres of expertise and their European counterpart work together in the European Reference Networks.
How are we going to help?
With this software application we focus on research into rare diseases within the Netherlands. It shows, per institution, which diseases or syndromes are being studied in terms of peer reviewed articles, in other words: which institutions contribute the most to our understanding of each disorder. And it shows what research is helping others to increase knowledge about rare diseases through citation analysis.
In addition, we have organized the information into special aggregations representing the acknowledged centres of expertise, the European reference networks and some patient associations, so we can identify where collaboration is occurring and where more collaboration may be possible.

How did we complete the project?
Building upon the trusted, globally sourced data found in Scopus®, we applied advanced data science and natural language processing to connect, organize and analyze research into rare diseases.
- First, using a Natural Language Processing (NLP) algorithm developed by the company SciBite, we were able to determine which publications were about which diseases and connect them to the relevant ORPHAcodes. We tested and refined this algorithm with the help of Dutch researchers who checked lists of publications being assigned to each ORPHAcodes for relevance and accuracy.
- We then created a connected dataset with accompanying citation-based metrics by analyzing those publications, using Scopus® metadata: author, institution, country, citations to and from other publications.
- We organized the information within this connected dataset into a dashboard, and that dashboard is included in this website and publicly accessible.
How to use this site.
Above you will find the rare diseases dashboard. The dataset used in the dashboard is limited to all relevant Dutch publications from the last 10 full years. And of these, you will see those publications that are about a disease for which an ORPHAcodes has been created. For more information about Orpha, see https://orpha.net
There are three sections in the dashboard:
- Overview
- ORPHAcodes
- Institution
‘Overview’ section
This section shows the total number of publications for all Orpha research at Dutch institutions. On the left panel you will see the following bibliometric indicators:
- Scholarly Output: number of publications
- Share of Scholarly Output: number of publications divided by total number of Dutch, relevant publications
- Citation Count: number of times the selected publications have been cited by other publications
- Citations per Publication: the citation count divided by the scholarly output
- Outputs in Top 10% Citation Percentiles: number of publications that are in the 10% most cited
Additionally, you will find a bubble visualization representing research areas organized by ORPHAcodes. Hovering over a circle with the cursor reveals which code is represented along with a chart.
At the top right, you will see the top 10 ORPHAcodes by Scholarly Output. Usign the drop-down you can also view the Top 10 ORPHAcodes by Citation Count.
Below that is a geographical ‘heatmap’ showing the locations of the researchers and Institutions contributing to research into each ORPHAcodes.

‘ORPHAcodes’ section
In this section you can see which institutions publish research for a given ORPHAcodes, or for a combination of ORPHAcodes. You can also look at the analyses per Expert Center (EC) or European Reference Network (ERN). These often focus on a combination of diseases. The analysis will then include all publications from each EC or ERN that have at least one of these diseases as a topic.
First, in the Main dropdown menu, you can select a disease, ERN or EC – more information on these groups can be found here.
Then in the Category dropdown menu, depending on the selection in the first dropdown, you can refine your analyses further by finding the disease, EC or ERN in the list or typing some characters of the EC, ERN, disease name or ORPHAcodes.
Finally, the third dropdown allows you to further refine your analyses to diseases of relevance.
IT IS IMPORTANT TO CLICK THE ORANGE BUTTON, AFTER SELECTION, TO CONFIRM AND APPLY YOUR CHOICES.
You will then see the disease with its code and relevant indicators for the Netherlands as a whole at the top of the section. The bottom of the section will display the geographical heat map along with a table of the contributing Institutions. This list in the table can be sorted by the given indicators, by clicking on the name of the indicator.
There is also a slider (above the charts and tables) that allows you to limit the view by Scholarly Output in order to shorten the list displayed.
You can also compare the selected analyses on the right-hand side, in two ways:
- The first is a matrix of Scholarly Output and Citation Count over the entire period.
- The second is a time series for an Institution selected in the table for Scholarly Output or Citation Count. for which setting can be selected by clicking on that setting, holding down the CTRL key (Windows) or the Command key (Apple) or by selecting an area in the matrix above using the cursor.
‘Institution’ section
This section allows institutions to identify the diseases where they stand out, in terms of publications and citations received.
At the top, an institution can be selected from the dropdown menu. The results below then display the relevant indicators for that institution. Again, don’t forget to click the orange button, or it won’t select.
The left-hand panel shows the totals for that institution for the last 10 years across five indicators. The central table shows which diseases were being studied at the Institution and five indicators for each disease.
You can also shorten the list displayed by using the slider that allows you to limit the view using Scholarly Output. Or you can select diseases in the dropdown. To do this all diseases first need to be deselected after which it will be possible to ‘check’ diseases you would like to make visible.
When a disease is clicked in the table, the two graphs on the right show how Scholarly Output and Citation Counts have changed over time. Each bar shows the total as well as the number of publications that are in the Top 10% most cited worldwide.
The disease selected is also copied by the dashboard to the ‘ORPHAcodes’ section where you can then go to investigate this disease and relevant analyses in more detail.
For rare conditions, it is not easy to see where expertise is present. This dashboard gives new insight by showing where research takes place.
– Ilse Nederveen, MSc, Sr Advisor Market Strategy & Collaboration, Erasmus MC
This dashboard provides insights we have been using already in our planning process. We now understand better where we are strong and where we can make the difference.
– Prof. Dr. R. Schutgens, UMC Utrecht
This dashboard is a great example of ‘Research Intelligence’. Available information on research is enriched and provided with additional dimensions. This allows us to help researchers and doctors identify collaboration partners, monitor the impact of publications, and determine their position in the field. It enables them to make more informed strategic choices in their research efforts.
– Rik Iping, Advisor Research intelligence & strategy Erasmus MC, Chairman Research Intelligence Network Netherlands
Research into rare disease deserves care and the best possible strategy. We are proud that our analytics and technology have contributed to these efforts.
– Max Dumoulin, VP innovations, Elsevier
Please contact us if you have questions or suggestions regarding this initiative:
Netherlands Federation of University Medical Centers (NFU):
Ilse Nederveen i.nederveen@erasmusmc.nl
Rik Iping r.iping@erasmusmc.nl
Elsevier:
Max Dumoulin m.dumoulin@elsevier.com
Guillaume Warnan g.warnan@elsevier.com